Product Overview
QDM Analyst is an easy-to-use and powerful data analysis tool, which is used to analyze users' quality data and create graphical reports, providing great convenience for users' data understanding.QDM can be used as an independent production tool to load data analysis, or as a data reading and analysis module for a larger QDM Web system.

• Create FAIR, PPAP, and quality reports in seconds
In QDM Analyst, users only need a simple mouse drag operation, can quickly create a report template, at the same time can quickly apply new quality data, immediately generate a new quality report.In a QDM Web system, the QDM Analyst tool is embedded to generate and access reports from anywhere.
• Measurement data from any source can be used
QDM Analyst can use the measurement data of any detection device, even without a pre-defined Excel form, or a custom data source.Through the pre-created data converter, QDM Analyst makes the data analysis clearer, faster and more effective.
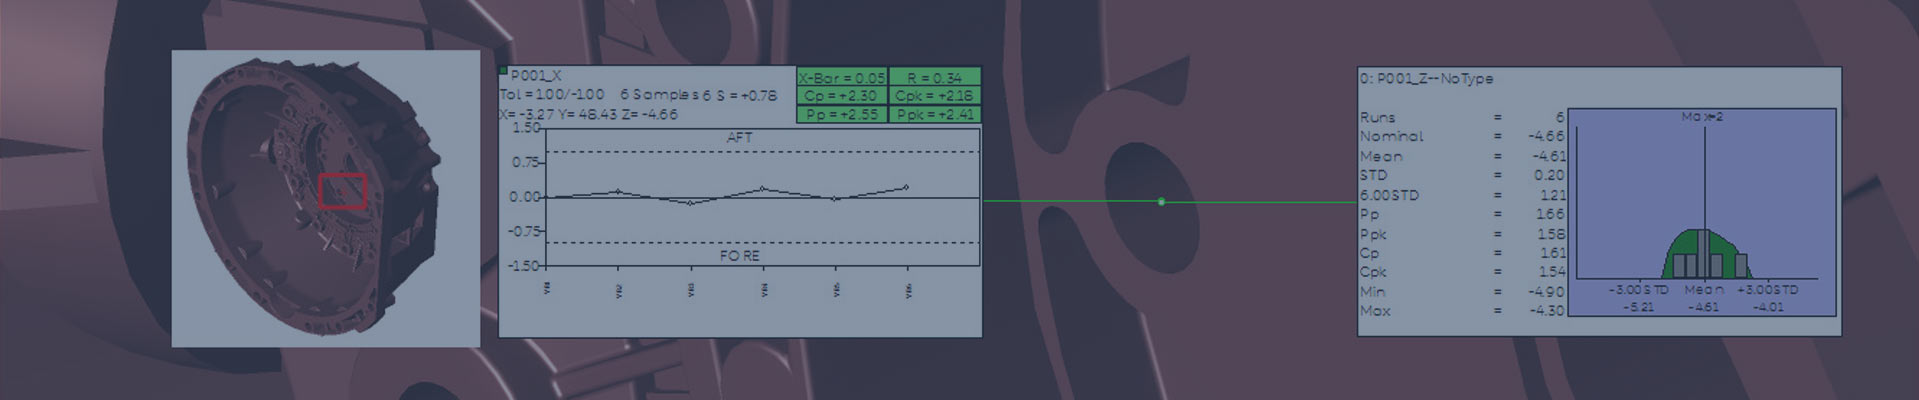
• Generate quality metrics, compare data and visualize product quality
Using a series of charts and processed indicators, QDM Analyst allows engineers to create quality reports, discuss product quality in a decision-making and quality report style, which combines analysis, charts, standard indicators and other information.
• QDM Analyst can load CAD graphics and associate with the current information
Graphically display the measurement target and discover the status of the current quality target.

Step 1:Index
Use color coding to evaluate the index performance of each point to show whether it is qualified/unqualified.The number is the page on which the detailed report for that point is located.

Step 2:Statistical charts -CPK, etc
Quickly calculate statistical indicators and add criteria of qualified/unqualified indicators.

Step 3:Function size, DTS calculation
Calculate the quality index of function size and display it on the CAD image.

Step 4:Equipment - process capability
Select the data set and calculate the process capability of machine tools, CNC, punch and other equipment.

Step 5:Run Charts
The final measurement data are continuously tracked and compared with the data of past products.

Step 6:Surface profile
Use color coding to quickly analyze and set up qualified/unqualified conditions to show the variation of surface contour deviation.

Step 7:The quality of cloud
Color visualization highlights problem areas for managers and team members to analyze and make decisions.

Step 8:Summary Chart
Displays all relevant data in an easy-to-read form for quick inspection and communication with quality experts.