Product Overview
QDM PDA is an advanced analytics tool for digging deep into your data.PADmodule can be used as part of QDM system to obtain data from QDM database or load its own data for analysis.
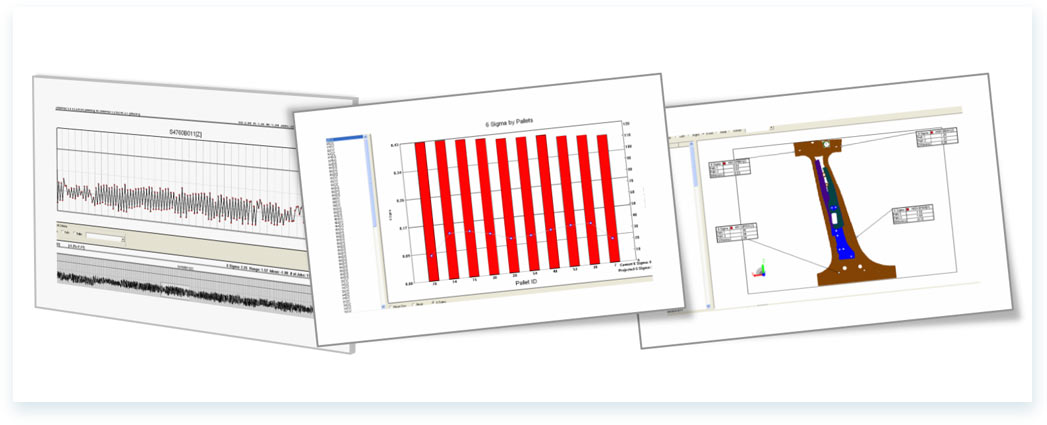
• Real-time analysis of factory data:Statistical analysis (SPC) was used to determine trends and patterns in real time.Insight into the data set and determine relevance based on time, place, machine, and operator to discover valuable insights in the process.
• Root cause analysis:In the specified impact source, identify the cause of the deviation.Deviation sources include tooling, handling tooling or old machinery and equipment, etc.
• Easy-to-use interface: When the mouse is over the dataset, the parameters of the data are automatically displayed: serial number, supplier name, assembly line, and handling/fixture for assembly.
• Focus on the important data:Display all the assembly data in a table to see which features to focus on.
• comparative data:Correlation analysis of data is used to determine the impact of changes.
• Graphical data monitoring:Use image and CAD data to display statistical analysis.
• As an independent data analysis tool or as part of a system:QDM PDA can be independently used for data analysis, or it can be combined with QDM WEB system, and real-time data can be obtained from the system to provide analysis reports.
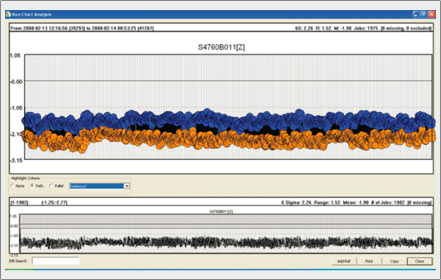
• Look at the source of the deviation and quickly analyze the root cause of the problem.
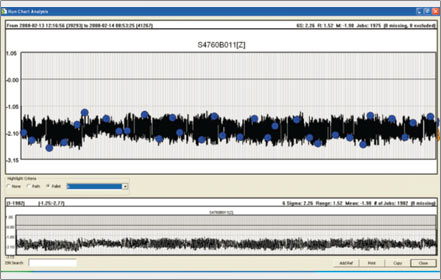
• Compare data and determine changes, deviations, and effects on assembly.
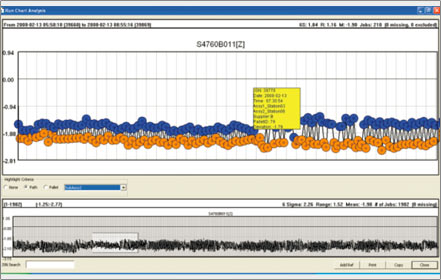
• Quickly analyze and review the impact of process changes, and analyze deviation changes; Quickly analyze and compare supplier A and supplier B capabilities.
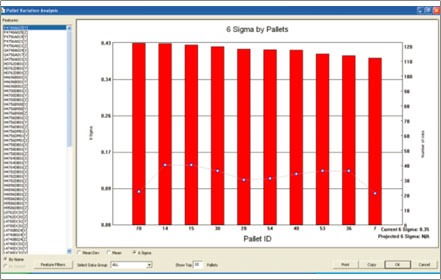
• Analyze the deviation data completely caused by fixture deviation, and quickly identify the fixture to be corrected on the assembly line.
